Global S&T Development Trend Analysis Platform of Resources and Environment
| Track to the future: climate change and your city | |
| admin | |
| 2020-04-17 | |
| 发布年 | 2020 |
| 语种 | 英语 |
| 国家 | 澳大利亚 |
| 领域 | 地球科学 |
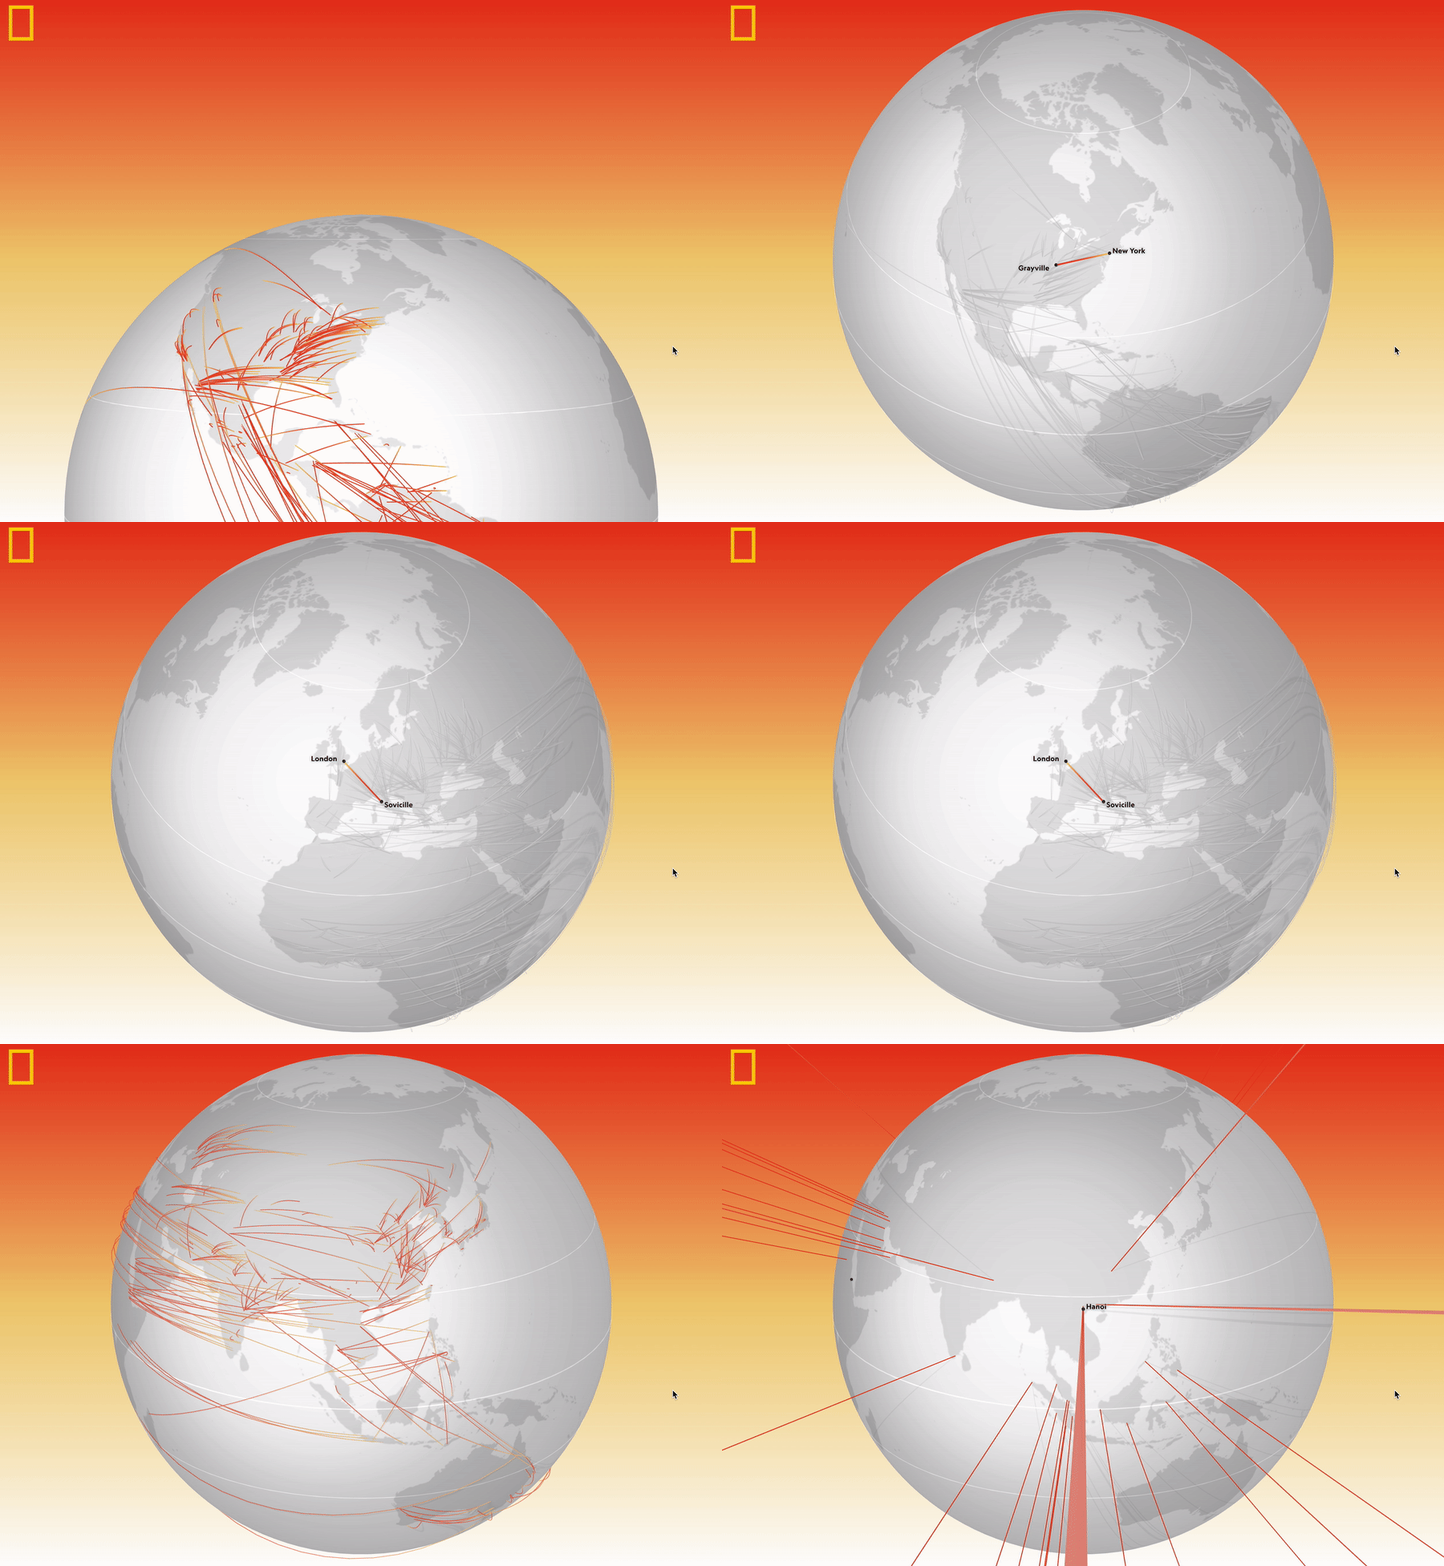
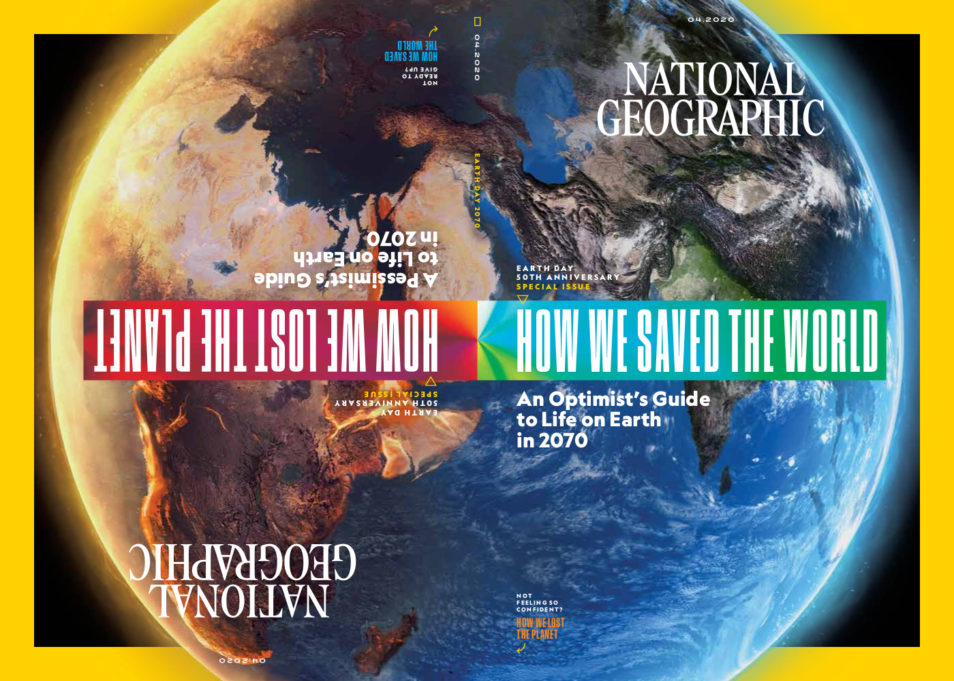
| 正文(英文) |  Your Climate, Changed is a new website to help you track the future climate of your city. Credit: Brian T. Jacobs, Riley Champine, Jason Treat/National Geographic. Wondering what your city’s climate will feel like in 2070? We’ve got great news. There’s a new experience at National Geographic. A website to answer your future climate questions. Your Climate, Changed has just launched as part of National Geographic’s World Earth Day (22 April) celebrations. Future citiesYour Climate, Changed allows you to track the future climate and how your city will change over the next 50 years. The interactive website uses data from our scientists and other researchers. It shows the climate predictions for 2500 cities all over the world, and which city they will feel like in 2070. This is known as a climate analogue – a current-day comparison. The analogue city is a way to approximate future climate change for your city. It demonstrates how your city’s average temperature and rainfall is likely to change. The website geolocates you to explore the future climate of where you live. But, you can also search for other cities to see how their climate could transform if emissions continue to rise and climate change impacts intensify. If you’re thinking of moving countries or cities, this is one way to decide where to live. You can choose based on your future climate preferences. Examples of Australia’s climateIn 50 years, Melbourne may feel similar to northern parts of Adelaide with much hotter summers. By 2070, Townsville in northern Queensland is forecast to shift from a temperate climate zone to a tropical savannah. The research predicts the number of days in the year over 35°C might increase dramatically in Townsville from five days in 2005 to 72 days in 2080.  Townsville looks like to shift climate zones by 2070 with a dramatic increase of extreme heat days. Image credit Your Climate, Changed. The website predicts Queensland’s Gold Coast may shift from a temperate climate zone to a tropical savannah in 2070. Research shows tropical cyclones are likely to head further south of the equator extending to the Gold Coast. In 2005 Alice Springs had an average of 116 days over 35°C. Researchers predict this will almost double to 203 days by 2080. Perth will experience more extreme heat events. The number of days in the year over 35°C may increase from eight days in 2008 to 42 days in 2080.  Your Climate, Changed shows the number of extreme heat events to rise in Perth, Australia. Like nowhere on Earth!There are 90 cities around the world with no current climate analogue. This means their climate will feel like no place on Earth right now. Hanoi in Vietnam is one such city. It will likely experience unique climate conditions in the future. The number of extreme heat days is forecast to increase dramatically. Temperatures over 35°C will increase from 11 days in 2005 to 147 in 2080. Abadan in Iran is also likely to experience unprecedented climate conditions. The number of days per year over 35°C will increase from 171 in 2005 to 209 days in 2080. It’s hard to imagine 209 days a year over 35°C. We don’t know exactly what the climate will be in 2070. Your Climate, Changed shows the best estimates based on comprehensive science.  A busy street in Hanoi in Vietnam. Image credit Heiko Carstens via Wikipedia. Track your future climate zoneThe climate zone predictions came from research led by Dr Hylke Beck, a data scientist from Princeton University in the USA. Hylke worked with a team of researchers, including our very own Dr Tim McVicar who is a Principal Research Scientist and ecohydrologist. Climate zones describe the environment you’re living in. For example, tropical rainforest, arid desert and polar tundra zones. Hylke’s team projected future climate zone conditions at an unprecedented scale of one kilometre resolution. National Geographic approached Hylke and his team to use their data on the website. Tim said the clarity of the website makes it easy to see how climates change over time. “Comparing the present day to the future, with such high resolution, allows the map-makers at National Geographic to clearly illustrate how a city and its surrounds will change over time,” he said.  April 2020 cover of National Geographic. Credit: National Geographic Mapping our futureThe dataset created by Hylke, Tim and the team is publicly available. Published in 2018 it has been used by governments and scientists on a myriad of research. This includes biodiversity modelling and virus research. Tim hopes the website gets people thinking. “The future climate zone data represents the average climate and the average doesn’t portray the climate extremes accurately,” he said. “For example, this year’s bushfire season in south eastern Australia is not the new normal, it will get worse by 2100. To avoid such a catastrophic future, individuals, communities, industries and governments need to band together to find workable solutions. We need leadership from all sectors.”  Your Climate, Changed – predicts Hobart will feel more like Leongatha in Victoria in 2070 including temperature, rainfall and seasonality. Image Credit Michael Fromholt |
| URL | 查看原文 |
| 来源平台 | Commonwealth Scientific and Industrial Research Organisation |
| 文献类型 | 新闻 |
| 条目标识符 | http://119.78.100.173/C666/handle/2XK7JSWQ/273938 |
| 专题 | 地球科学 |
| 推荐引用方式 GB/T 7714 | admin. Track to the future: climate change and your city. 2020. |
| 条目包含的文件 | 条目无相关文件。 | |||||
| 个性服务 |
| 推荐该条目 |
| 保存到收藏夹 |
| 查看访问统计 |
| 导出为Endnote文件 |
| 谷歌学术 |
| 谷歌学术中相似的文章 |
| [admin]的文章 |
| 百度学术 |
| 百度学术中相似的文章 |
| [admin]的文章 |
| 必应学术 |
| 必应学术中相似的文章 |
| [admin]的文章 |
| 相关权益政策 |
| 暂无数据 |
| 收藏/分享 |
除非特别说明,本系统中所有内容都受版权保护,并保留所有权利。
修改评论