Global S&T Development Trend Analysis Platform of Resources and Environment
| Trends in the Australian Agricultural Workforce analyses 20 years of census data | ||||||||||||||||||||||||||||||||||||||||||||||||||||||||||||||||||||||||||||||||||||||||||||||||||||||||||||||||||||
| admin | ||||||||||||||||||||||||||||||||||||||||||||||||||||||||||||||||||||||||||||||||||||||||||||||||||||||||||||||||||||
| 2020-12-02 | ||||||||||||||||||||||||||||||||||||||||||||||||||||||||||||||||||||||||||||||||||||||||||||||||||||||||||||||||||||
| 出版年 | 2020 | |||||||||||||||||||||||||||||||||||||||||||||||||||||||||||||||||||||||||||||||||||||||||||||||||||||||||||||||||||
| 国家 | 澳大利亚 | |||||||||||||||||||||||||||||||||||||||||||||||||||||||||||||||||||||||||||||||||||||||||||||||||||||||||||||||||||
| 领域 | 资源环境 | |||||||||||||||||||||||||||||||||||||||||||||||||||||||||||||||||||||||||||||||||||||||||||||||||||||||||||||||||||
| 英文摘要 | What can data from the Census of Population and Housing tell us about changes in agricultural employment?Authors: Neil Barr and Robert Kancans 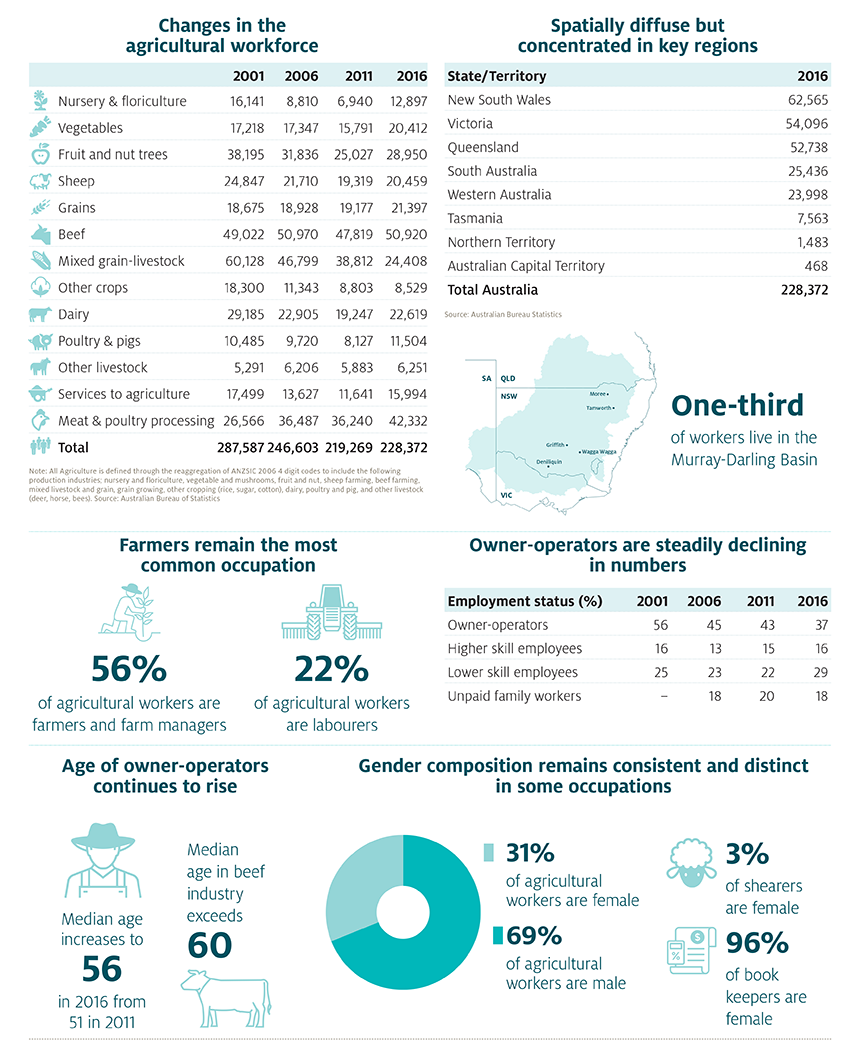
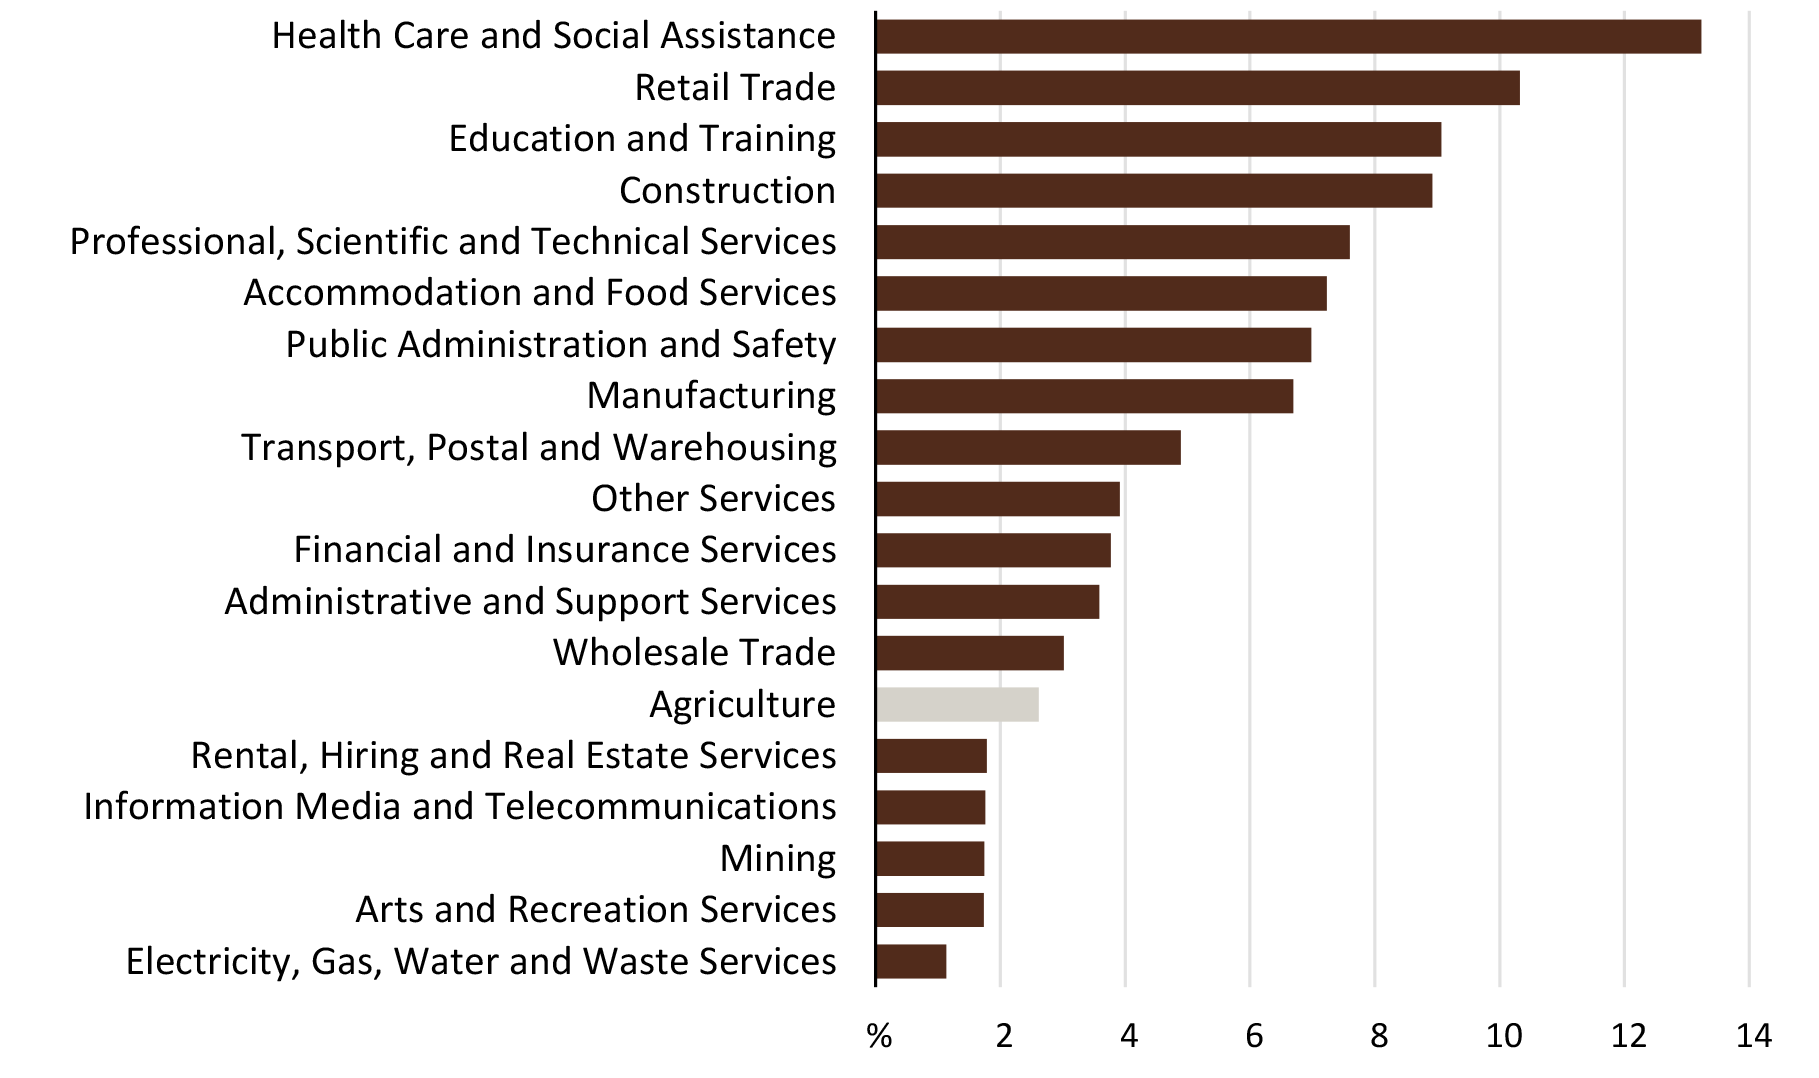
Note: Derived from analysis of historic data from the Australian Bureau of Statistics (ABS) Census of Population and Housing (CPH). Limitations of the CPH including capturing data on overseas travellers working in the agriculture sector, seasonal workers (outside the CPH collection period) and contractors. SummaryThe size, composition and characteristics of the Australian agricultural workforce has undergone significant change over the past two decades. A downward trend in absolute numbers appears to be entrenched as external forces reshape the type and volume of labour required to underpin a productive, competitive and sustainable Australian agriculture industry. To further understand the dynamics of this change and provide insights into the future, ABARES was commissioned—as part of a budget commitment in 2018—to undertake a detailed analysis of historical data from the Australian Bureau of Statistics (ABS) Census of Population and Housing (CPH) to provide an understanding of change in agricultural employment between 1996 and 2016. The ABS CPH datasets have significant capability as a tool for describing and analysing the size and characteristics of the agricultural workforce at a fine scale across sub-industries, and through time and space. However, key limitations of the CPH are its ability to capture overseas travellers who work in the agriculture sector, those engaged in seasonal work (outside of the CPH collection period) and contractors working in the sector. Furthermore, changes made to geographical and industry classifications used in the Census restrict the ability to undertake some time series analyses. Key findings[expand all]Share of the Australian economyAustralian agriculture employed 228,372 people and contributed 2.6% to the national labour force in 2016. Over the decade 2006-16, agricultures’ contribution to the national labour force declined by 3.1% along with the wholesale trade and manufacturing sectors, while all other sectors experienced growth.
Agricultural production employment is trending downwardsOver the past two decades there has been an overall downward trend nationally in the absolute number of people employed in agriculture. The total agricultural workforce in 1996 was 280,544 falling to 228,372 by 2016, which is a 19% decrease. However, there has been some volatility across intercensal periods. Following a small increase in employment in agriculture between 1996 and 2001 there was a decline in measured employment in the decade 2001-2011. This trend halted in 2011-2016 with a slight rise in employment. There has been little change in employment in services to agriculture from 1996 to 2016, while employment in meat and poultry processing shows a strong rise in measured employment, especially for unskilled labour over the period 2001-16. 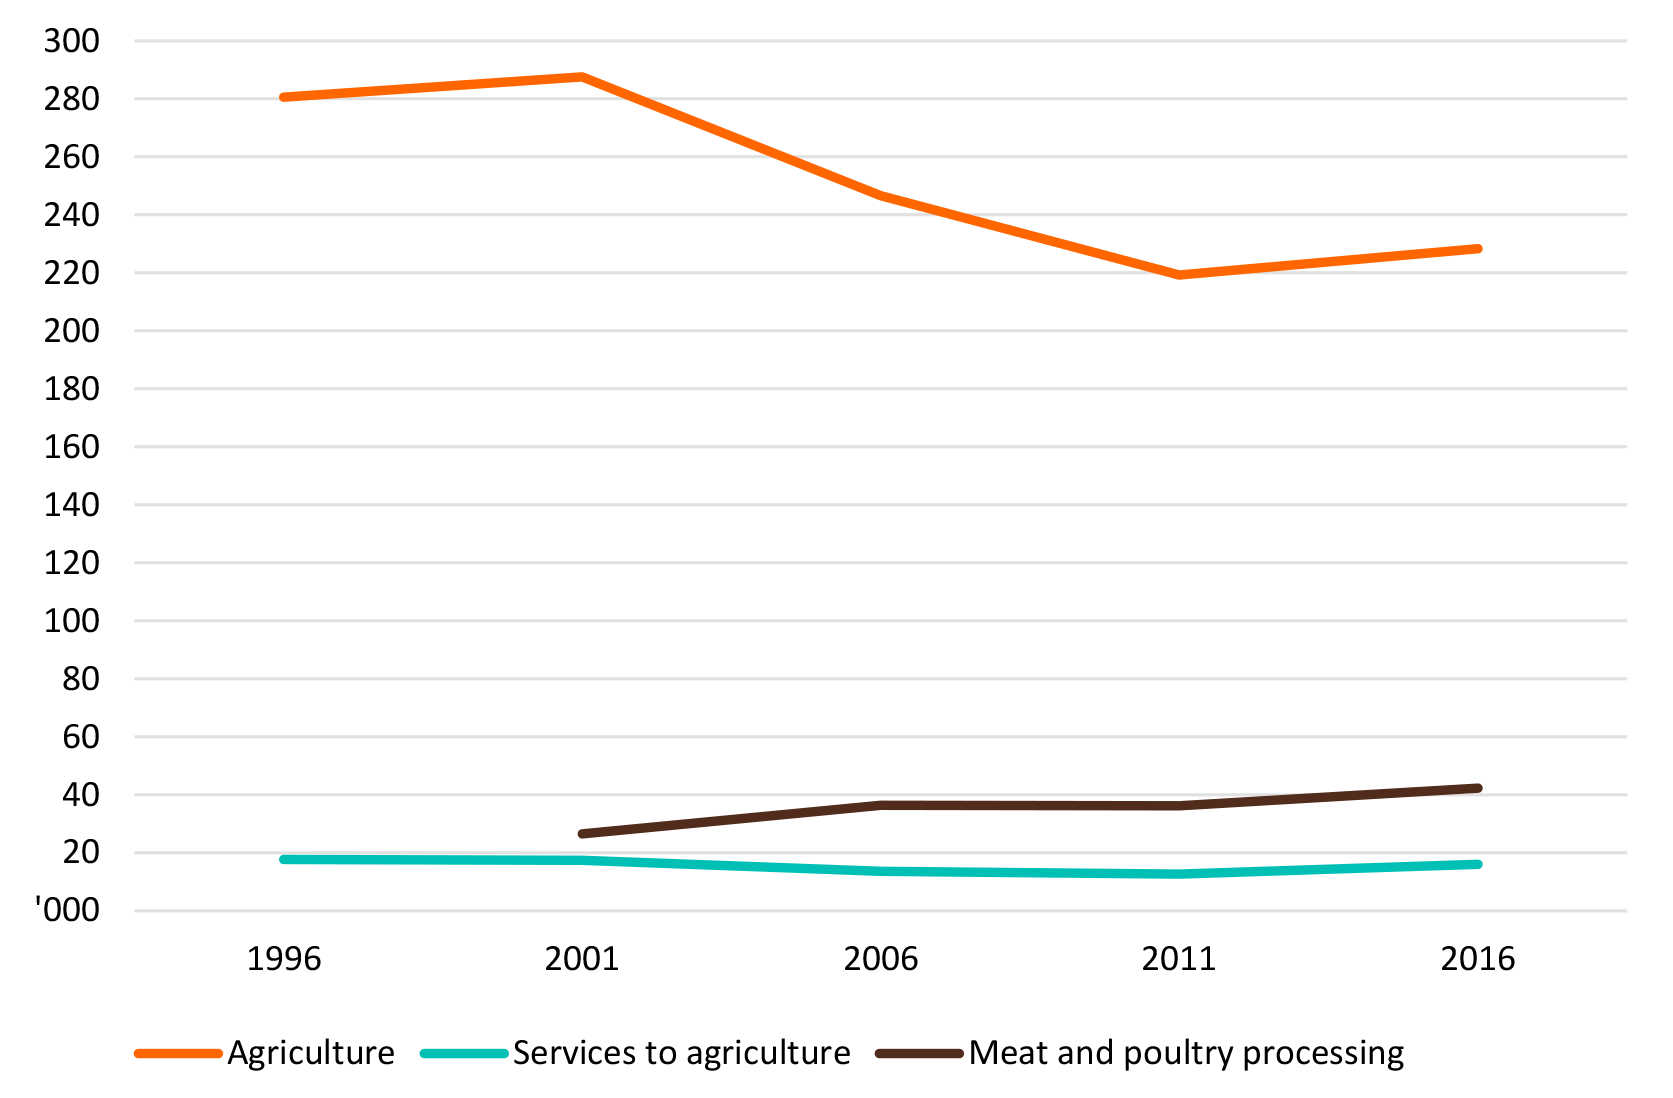
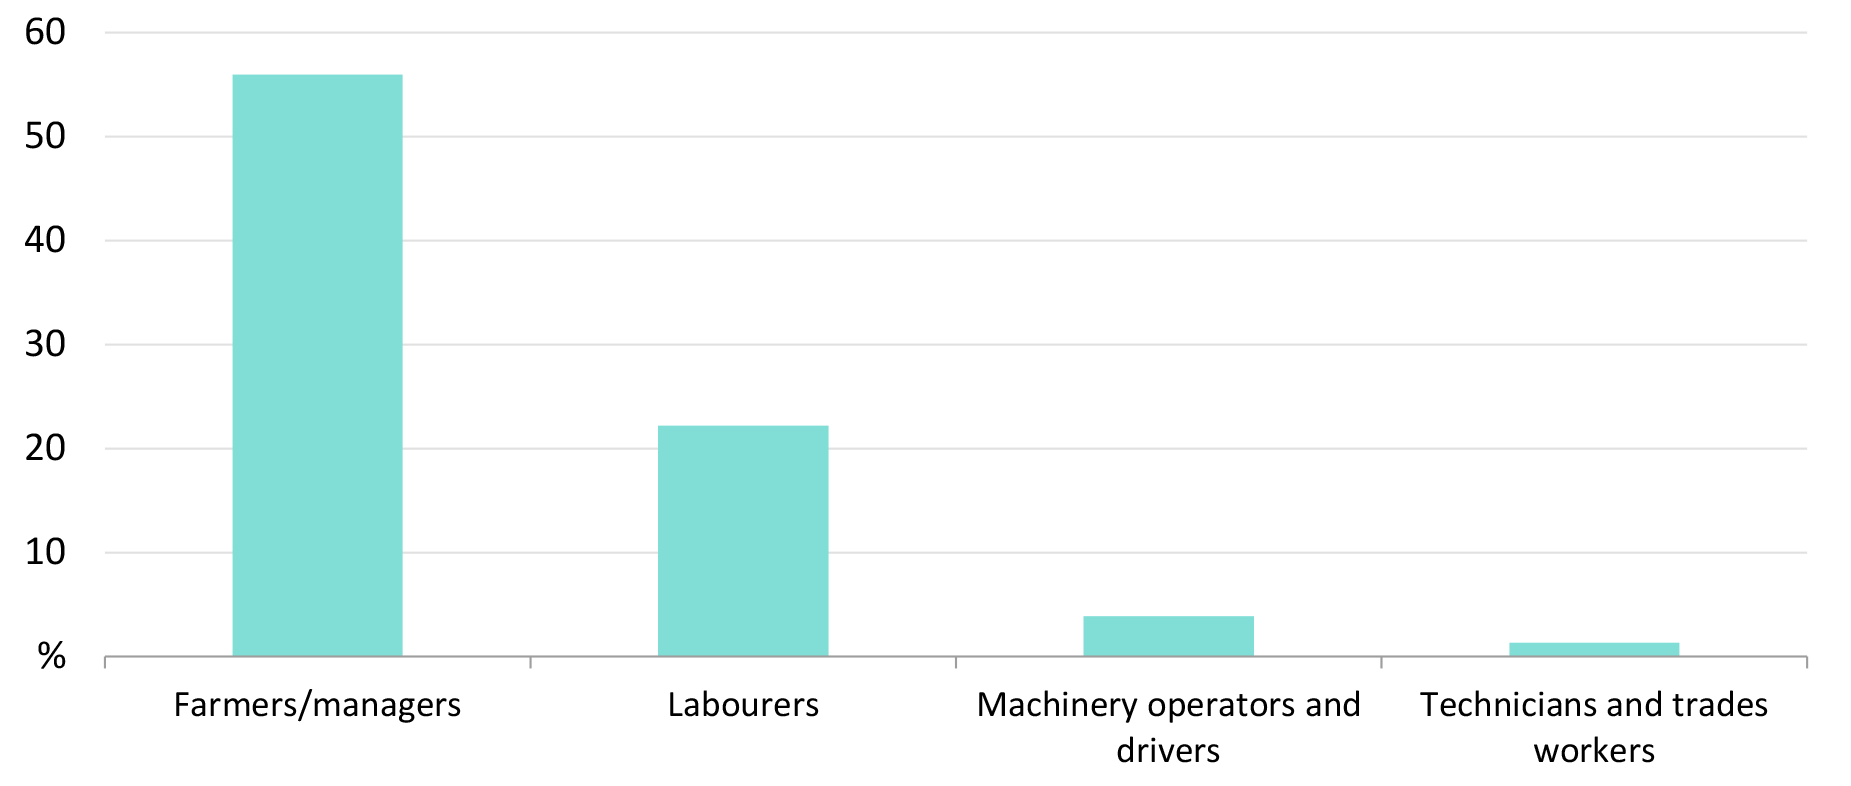
Spatially diffuse but concentrated in key regionsThe Australian agricultural workforce is mostly dispersed across regional, rural and remote Australia, with numerous regional clusters across most jurisdictions. New South Wales (NSW), Victoria (VIC) and Queensland (QLD) represent 74% of the total agricultural employment. In 2016, slightly over one-third (76 801 persons) of all agricultural employment occurred in the Murray-Darling Basin (MDB), with significant contributions from the regions of Griffith, Wagga Wagga, Moree, had the highest absolute numbers. Banana, Wambo, Central Highlands, Roma, Burdekin, Tully and Bundaberg in QLD, Virginia in South Australia (SA) and Gingin and Dandaragan in Western Australia (WA) all had over 1,000 persons working in production agriculture. Tasmania (TAS), the Northern Territory (NT) and the Australian Capital Territory (ACT) have the lowest numbers of agricultural workers. 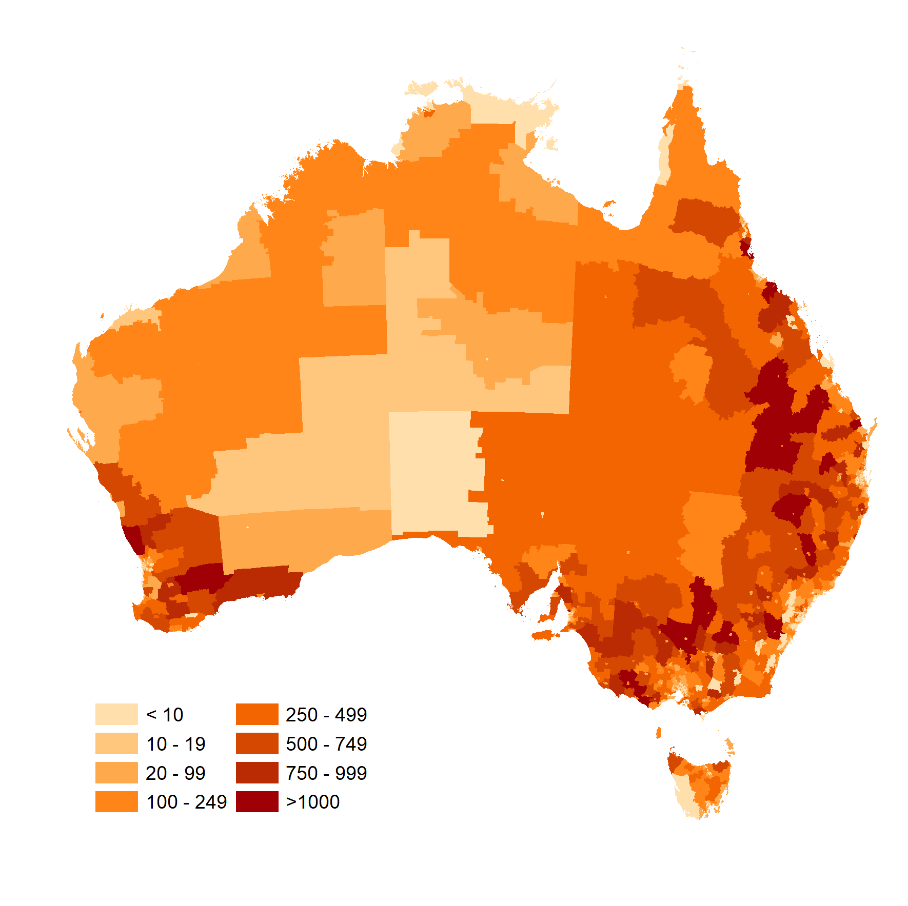 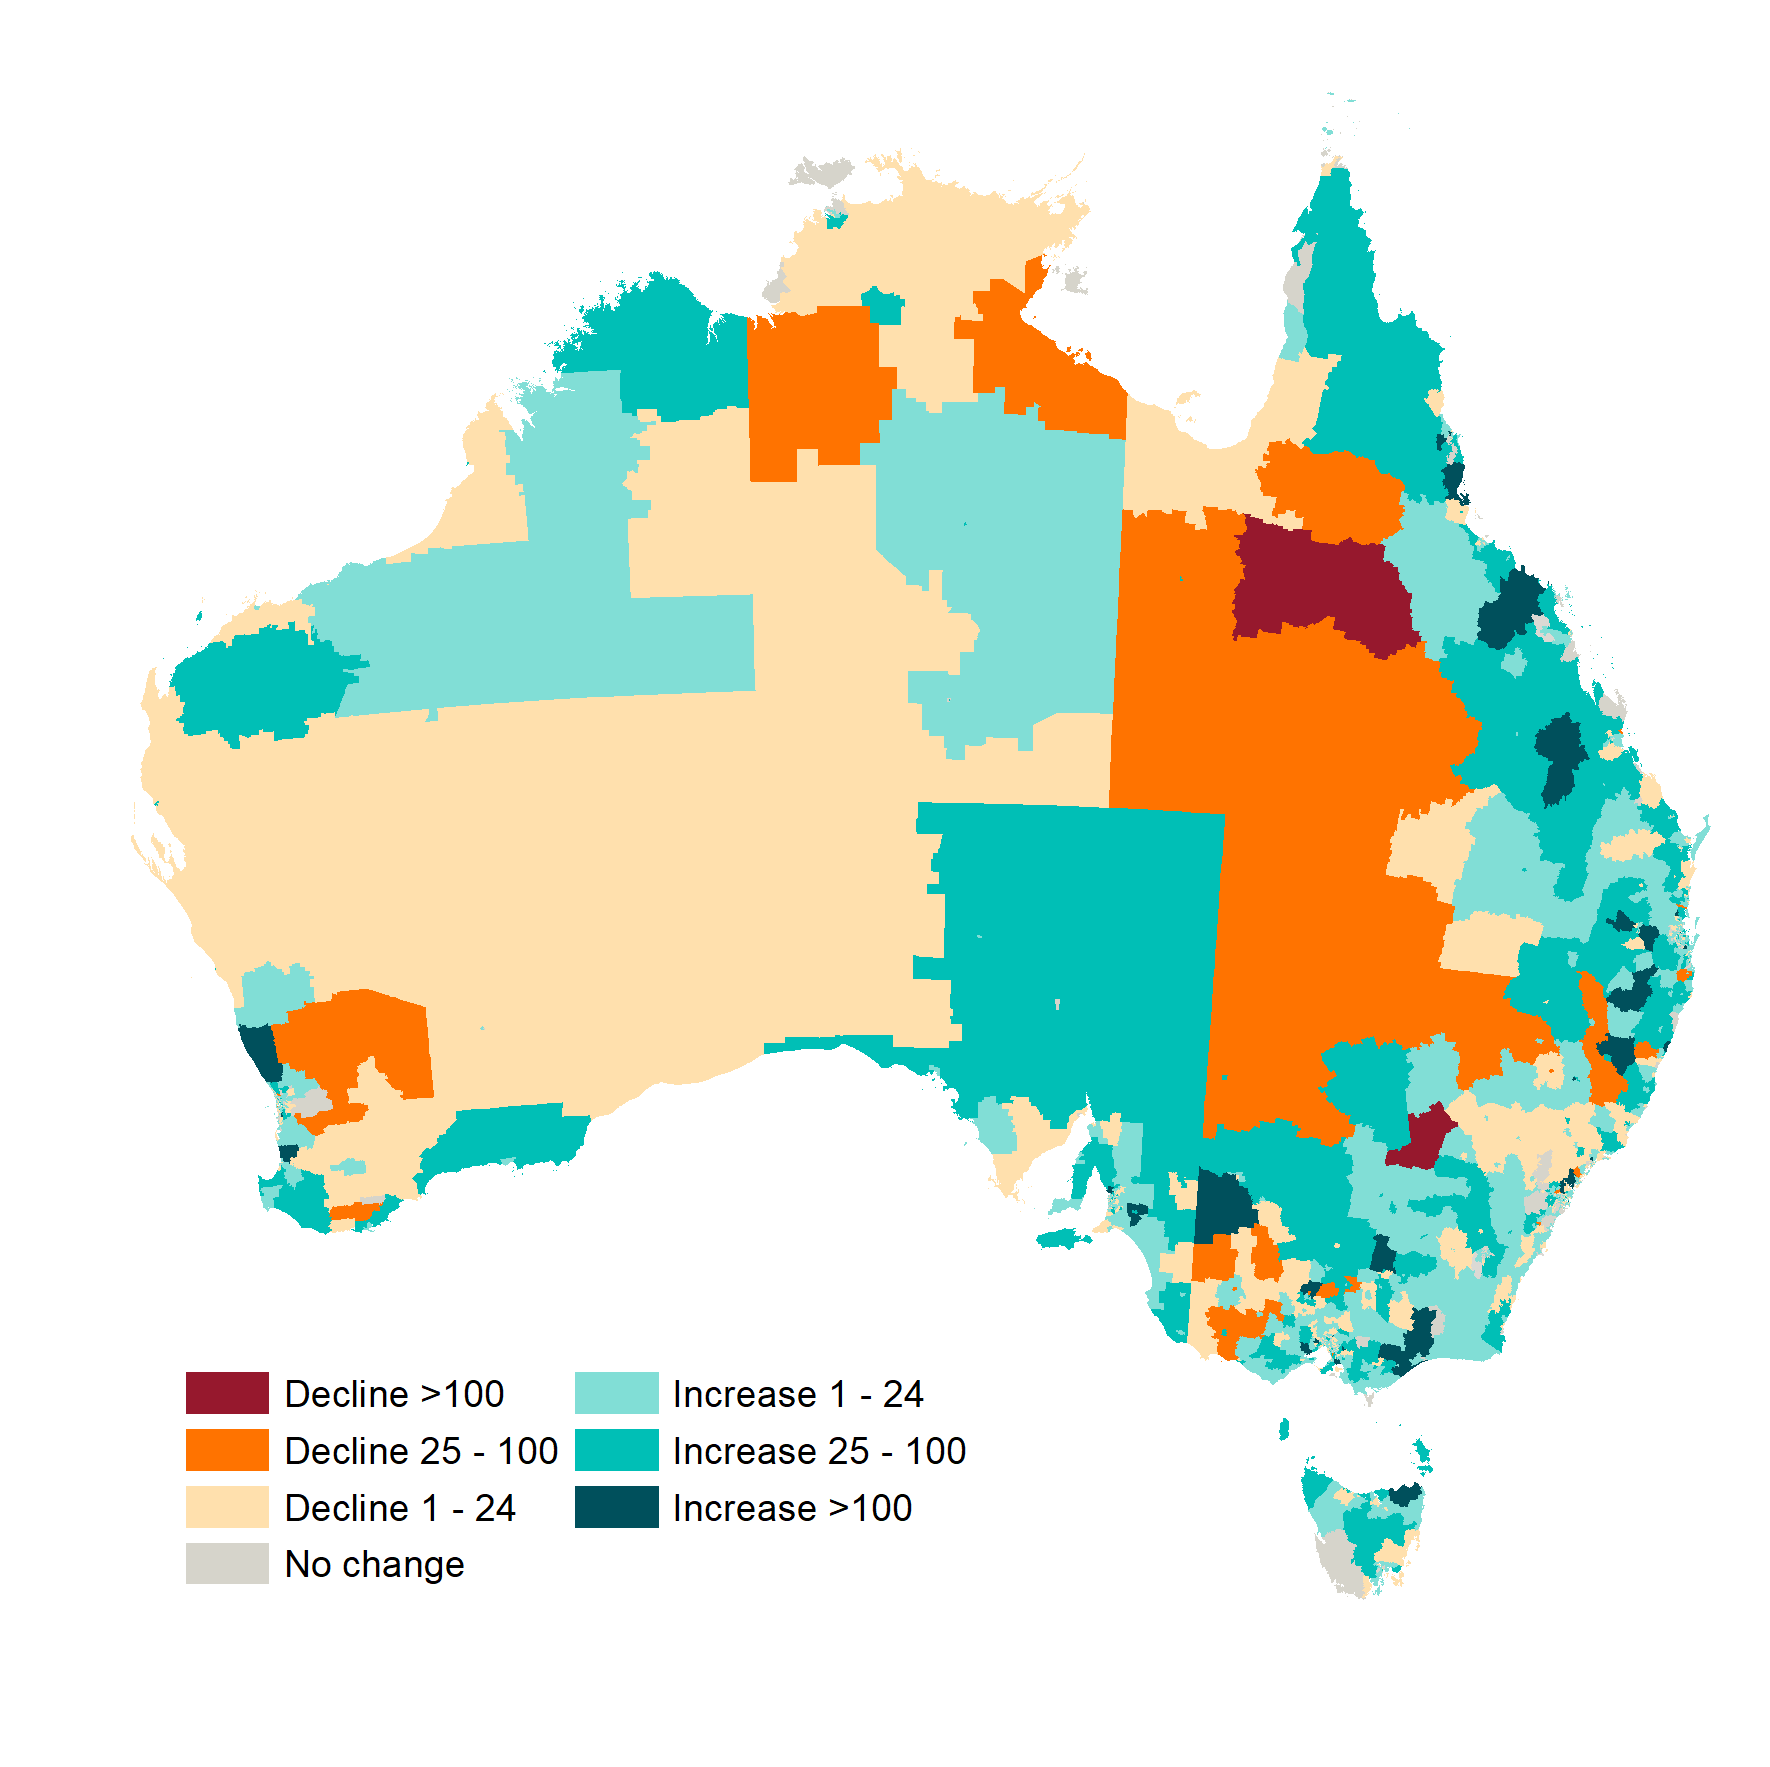 There have been modest regional increases in agricultural employment between 2011 and 2016 in all States and Territories. Significant increases have been observed in the Scottsdale region in Tasmania (500 persons) and in the Woolgoolga-Arrawarra region just to the north of Coffs harbour in NSW. The largest declines in employment have been across an area in QLD stretching from the Northern Tablelands, across to Mount Isa, down through Longreach and Charleville and into the northern NSW regions of Bourke, Brewarrina, Narrabri and Inverell. These areas in total have experienced a measured loss of agricultural employment nearing 800 persons during this 5-year period. Sub-industry employmentAt a sub-industry level (see Box 1 definition) there has been significant volatility in employment across intercensal years. The 2001-06 period witnessed a decline across 7 of the 11 agricultural sub-industries, with significant changes to employment in nursery (-45%), beef (-22%), dairy (-21%) and services to agriculture (-22%). Between 2006 and 2011, there were dramatic declines in employment across all agricultural sub-industries. The 2011-16 period saw recovery and increasing employment in most sub-industries except for beef (-36%) and other crop growing (-3%). Across the 15 year period between 2001 and 2016 there was significant employment growth in meat and poultry processing sector, and modest employment growth across vegetables, other livestock (deer, horses, bees, etc), mixed grain-livestock and intensive industries (pigs and poultry). During the same period the number of persons working in beef, other crops, fruit and nut trees, dairy, nursery and floriculture and sheep declined. Occupations in agricultureThe Australian agricultural workforce is made up of a diverse array of occupations. Like in most sectors, a given agricultural business requires workers with skills in business management, finance, sales, distribution and marketing, research, technical trades, plant operators and unskilled occupations. Farmers and farm managers remain by far the most common occupational category working in agriculture, accounting for 56% of all persons working in the sector. Of these, nearly 50% were livestock farmers and farm managers, with labourers accounting for a further 22%.
The farmer and farm manager occupational classification accounted for the largest decrease between 2006 and 2016 with a reduction of approximately 33,600 persons. The largest increases in occupational counts between 2006 and 2016 were in the classifications of farmer and farm manager–not further defined (nfd) (4,661 persons), livestock farm worker (1537 persons), and garden and nursery labouring (1412 persons) categories. Employment statusAgriculture is unique compared to other sectors regarding the make-up of workers, with higher proportions of owner-operators and unpaid family workers. The composite variable ‘employment status’ (owner-operator, higher skilled, lower skilled employee and unpaid family worker) allows a deeper understanding of the characteristics and changes within the agricultural workforce. Composition of agricultural workforce by employment status, 2001–2016
Broadacre industries have a greater proportion of owner-operators and a lower proportion of employees working in the industry. This is most evident in the beef industry with owner-operators and unpaid family workers outnumbering employees three to one. 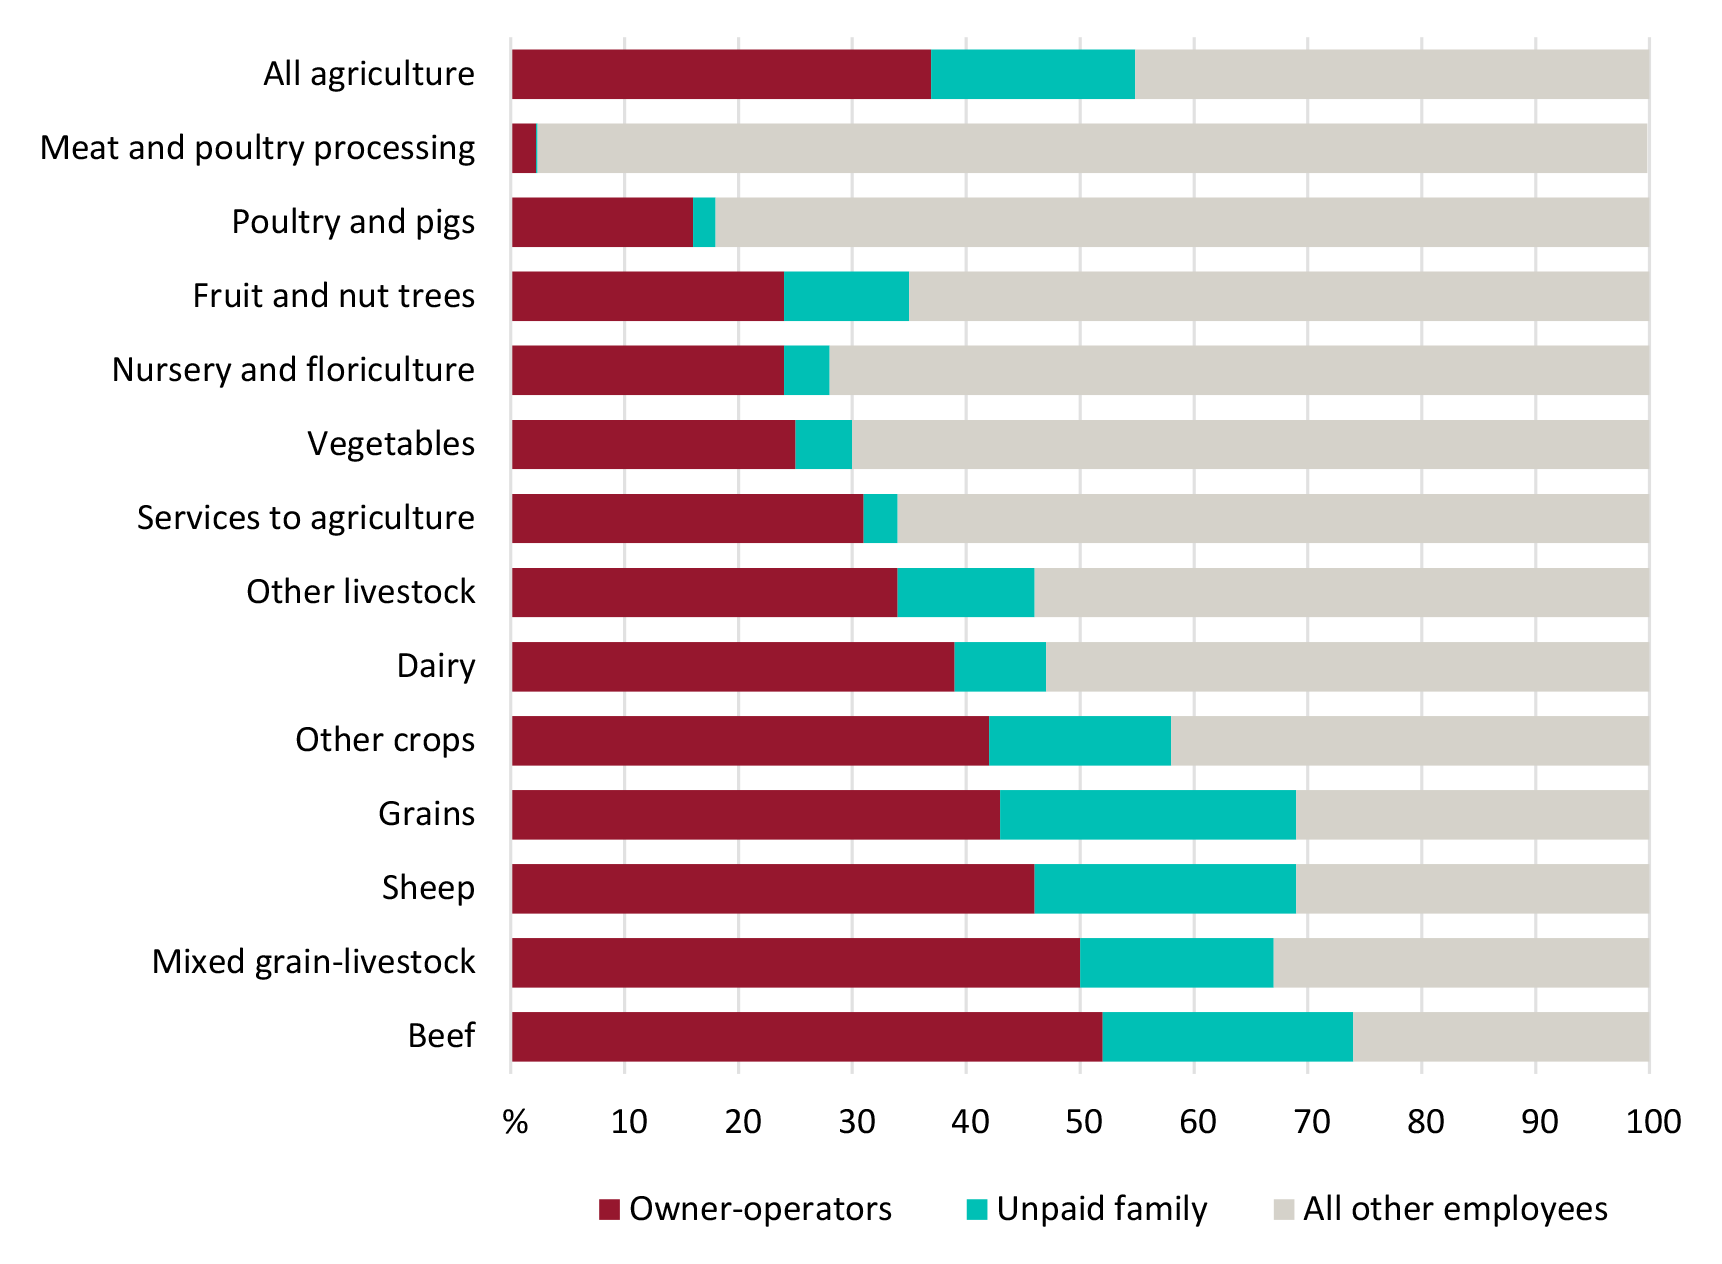 A steady decline in the count and percentage of owner-operators is observed from 2001 to 2016. The owner-operator share of employment in all agricultural sub-industries is declining. Dairy and grains have seen the greatest decrease with a 26% and 22% decline, respectively, between 2001 and 2016. The situation for higher skill employees through 2001-16 is mixed. Higher-skill employee share is declining in broadacre industries and meat and poultry processing, but increasing in intensive animals, dairy and horticulture. The lower-skill employee share was increasing across 2001-16 in most agricultural industries, except for other crops (predominately sugar cane and cotton) and fruit and nut tree growing. Unpaid family members are an increasing proportion of labour across all agriculture. This is especially the case in broadacre industries. For example, the proportion of unpaid family members contributing labour to the grains industry increased from 4% in 2001 to 29% in 2016. The underlying cause of these changes may be related to a combination of factors such as:
Mobility and exitingThe low rates of residential mobility amongst agricultural owner-operators are unique to the agricultural sector. All other industries have owner-operator residential mobility of around 38%, more comparable to the residential mobility of employees within the agriculture sector. Change in usual residence in last 5 years, industry comparison, 2016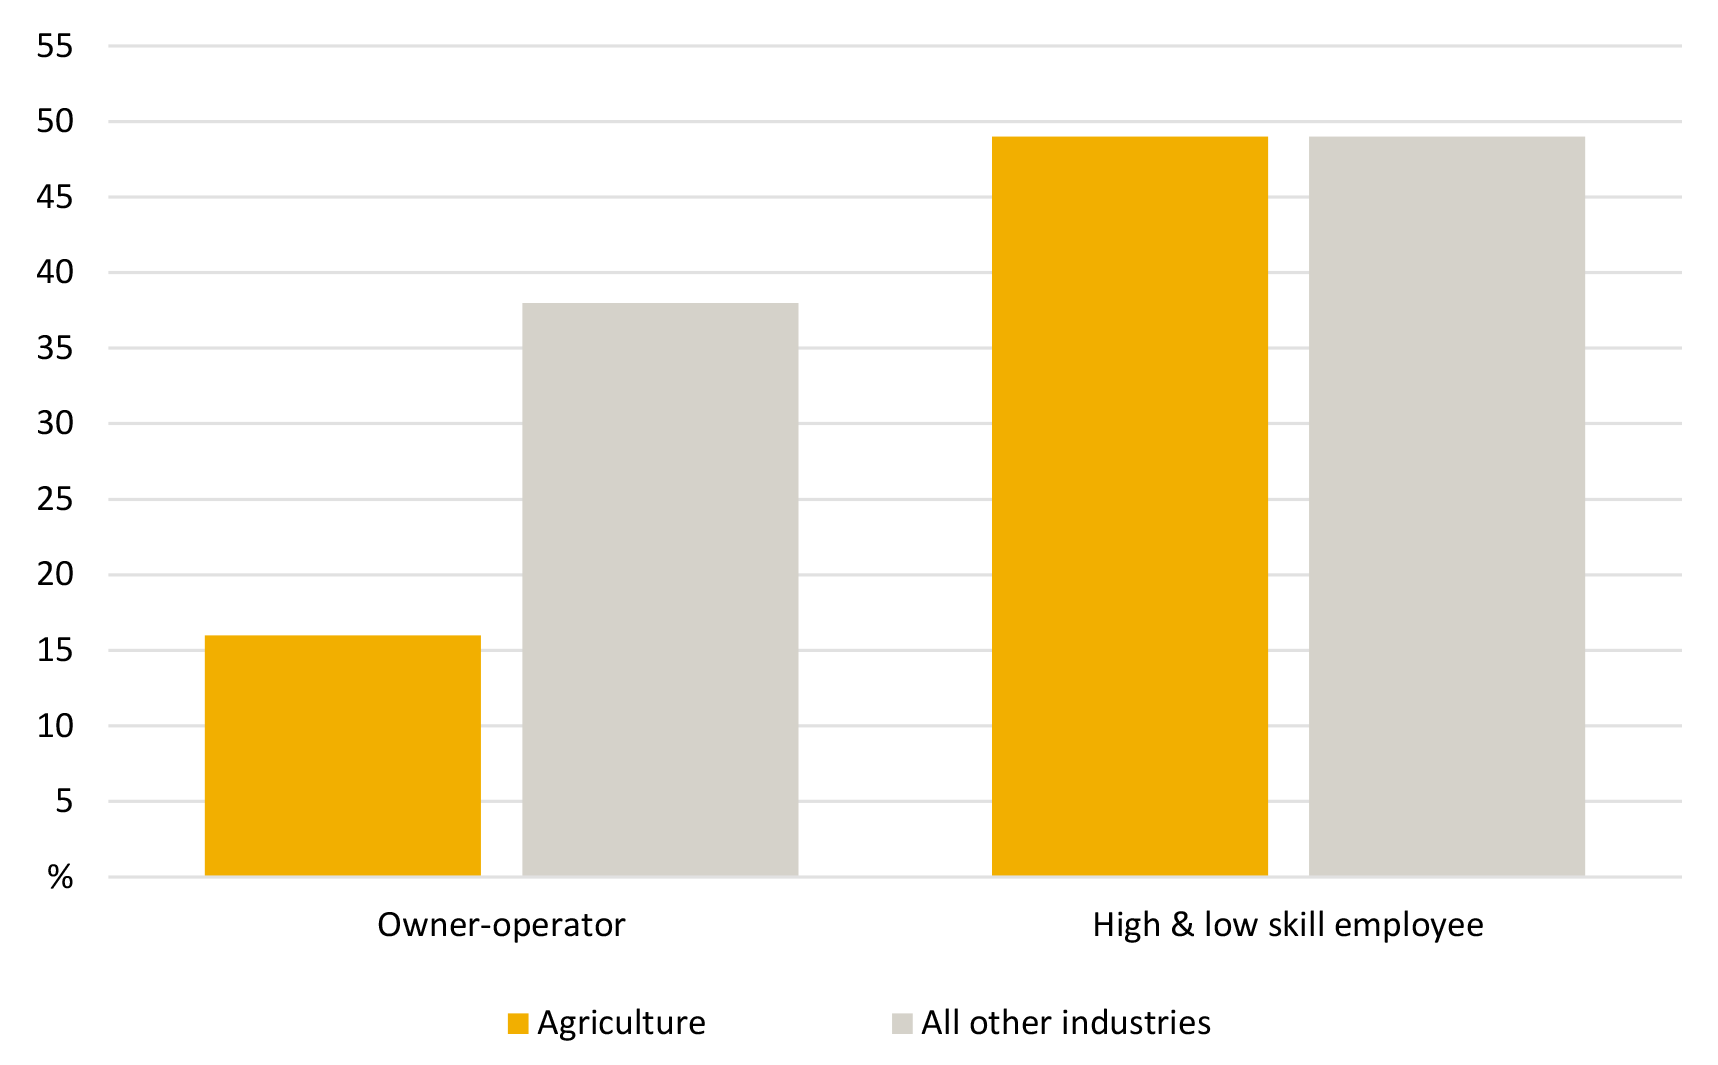 The rate of residential mobility amongst the employee class within agriculture may appear high when compared with owner-operators in agriculture, but it is close to that observed amongst employees in the Australian workforce as a whole. In comparing changes in usual residences between censuses, for owner-operators and unpaid family members a change of usual residence is almost three times more likely for those who have left agriculture compared with employees who left agriculture. Employees have a higher degree of mobility where over one-third that remain in agriculture will move usual residence during an inter-censal period. Agricultural employees have an inter-censal exit rate of between 40% and 70%. Most agricultural workers counted in a census will leave the industry before the next census. This rate of exit is much higher than seen with owner-operators, whose rate is around 30% across a five-year intercensal period; at a rate of approximately 7% per annum. Unlike most agricultural employees, the reason for owner-operators exiting is generally retirement from employment rather than shifting to a different sector for employment. The rates of exit of employees from the agricultural sector may seem high, but they are in line with other sectors of the Australian economy. Intercensal exit rates, by employment status, 2006–2016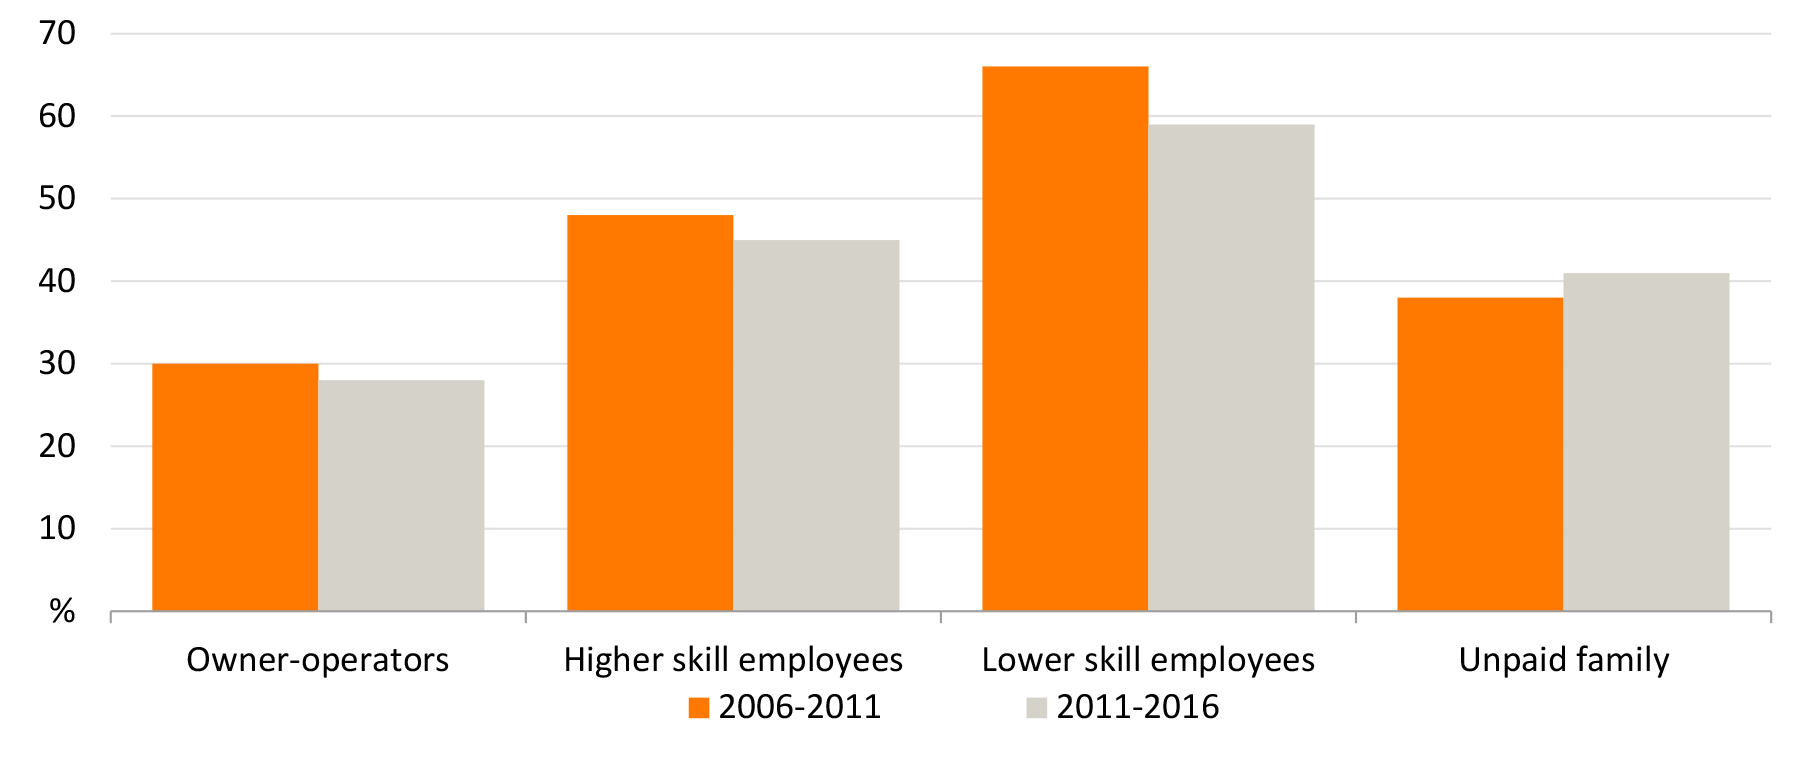 Annual exit rates from agriculture
Age structure also influences exit rate. With each employment status category, the rates of exit were higher for younger and older workers, and lowest for mid-career workers across 2001 to 2016. Spatial patterns of adjustment in owner-operator sectorSpatial analysis of entry and exit patterns of agricultural owner-operators provides an indication of structural trends such as farm aggregation and intensification across agricultural industries and guides further investigation into the factors driving change. Sectoral entry and exit rates in the agriculture sector are not geographically homogenous. Four adjustment categories are observed:
Pattern of entry and exit adjustment for owner-operators by SA2, 2011–16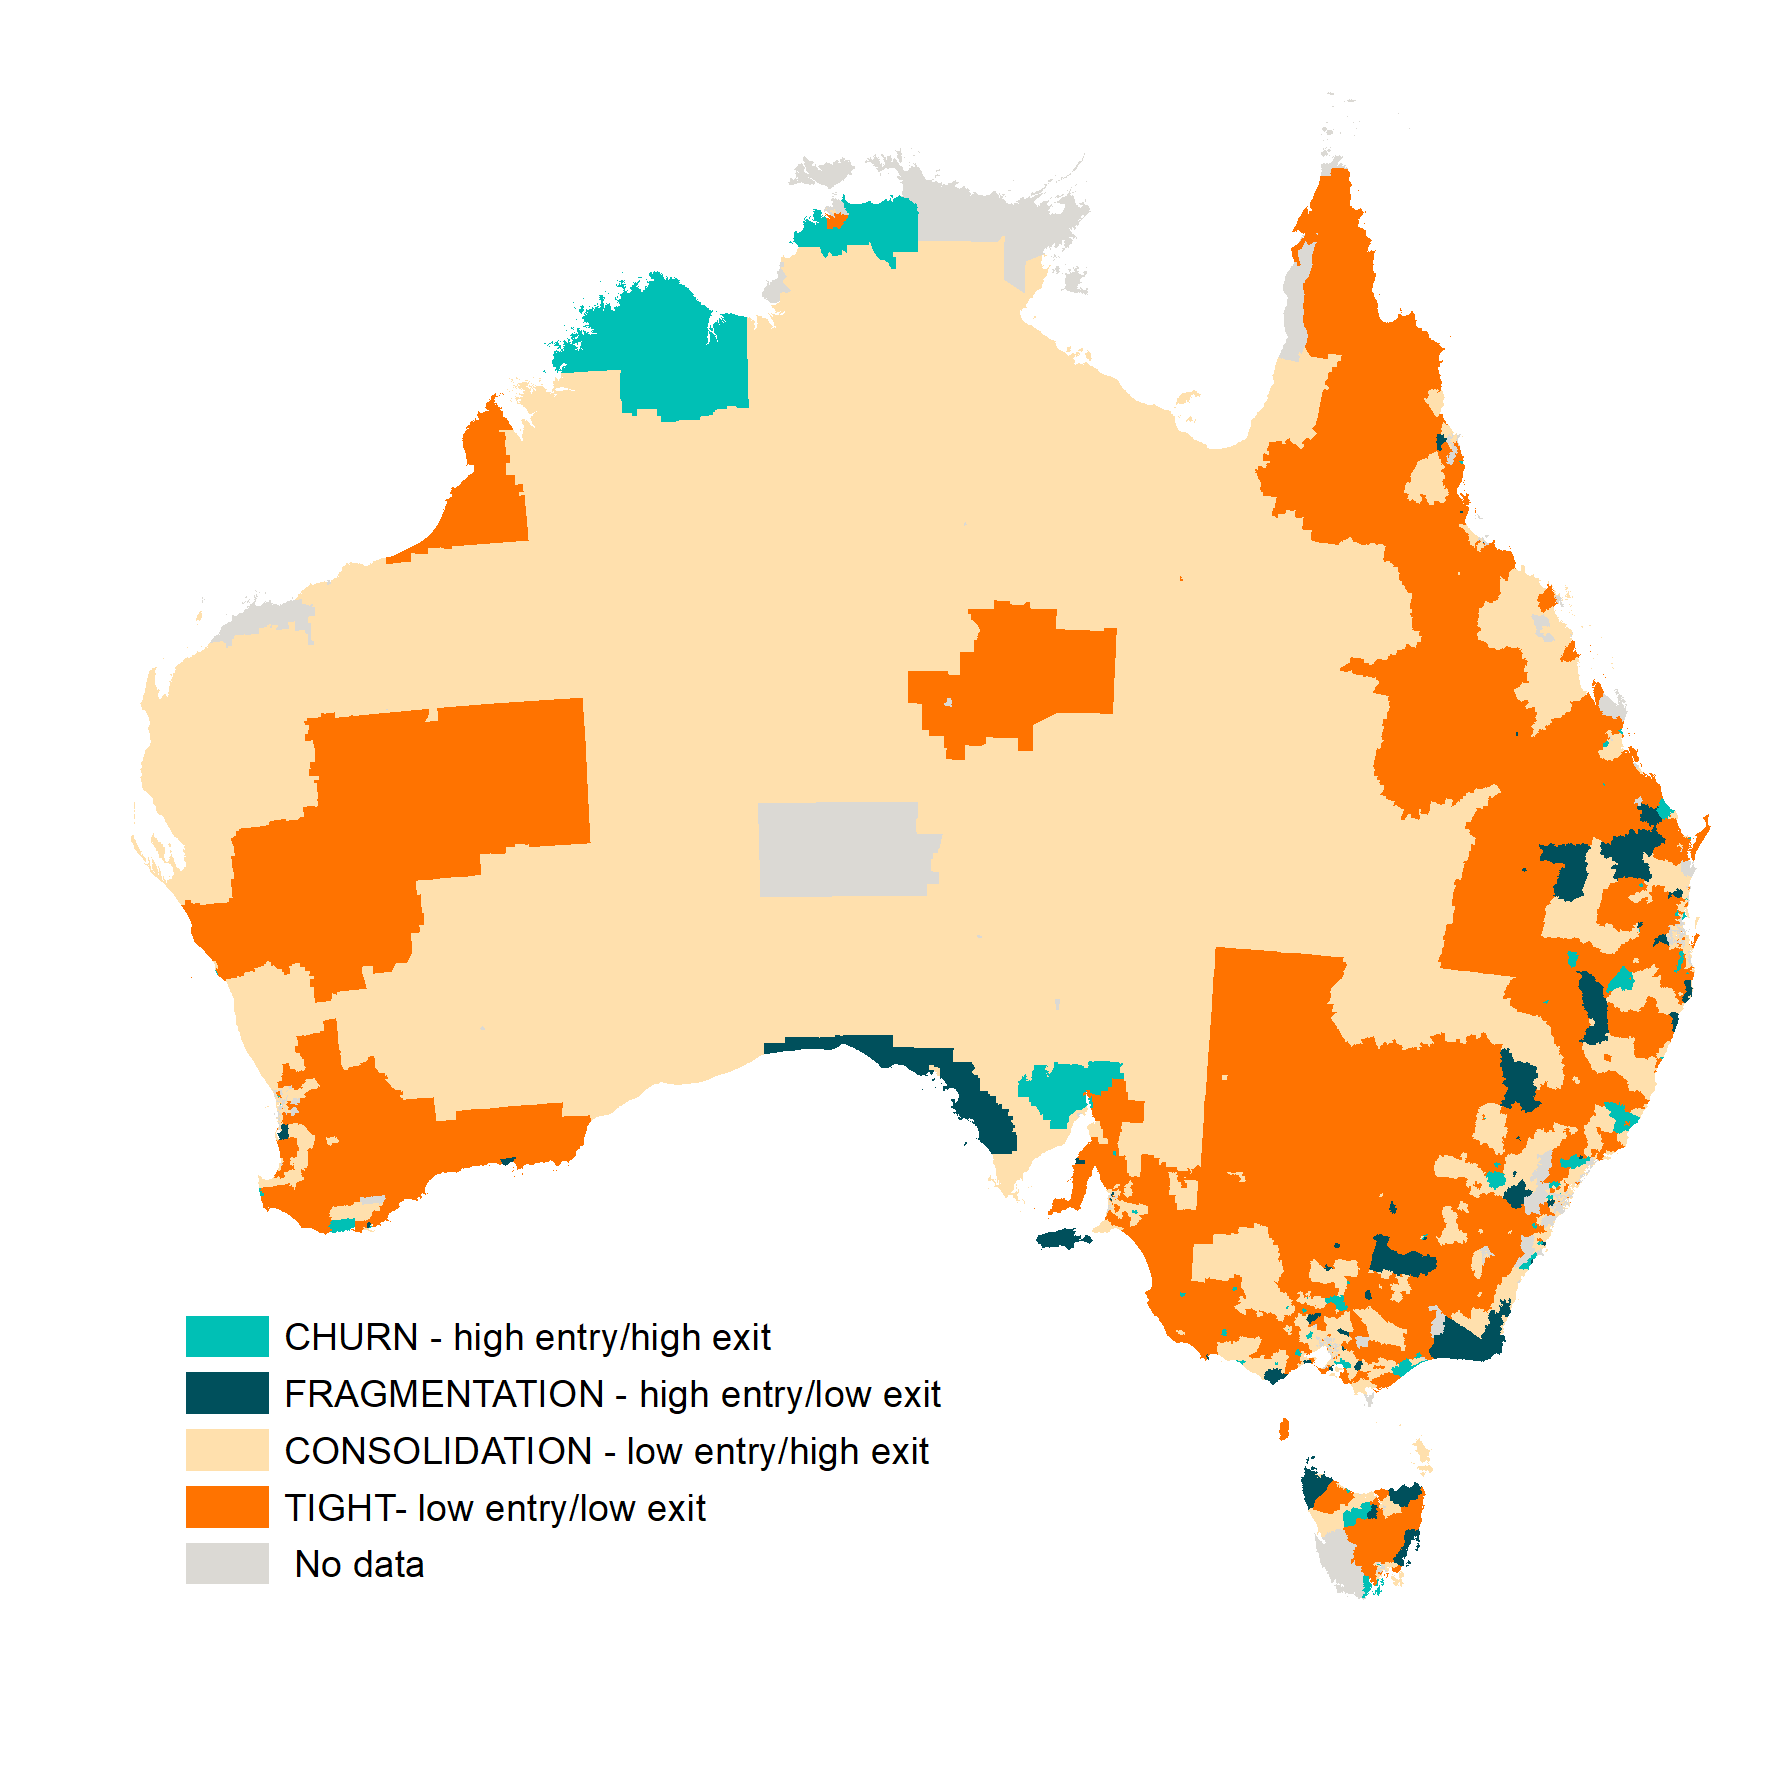 AgeThe median age of farm owner-operators continues to rise, reaching 56 years of age in 2016, from 51 years in 2001. There is no sign of structural ageing in the farm employee cohort with the median remaining around 40 years of age for the past four censuses. This rate of structural ageing is not unique to agriculture, as the rate of rise in owner-operator age across the whole Australian workforce was 3.5 years between 2006 and 2016. Median age, 2001–2016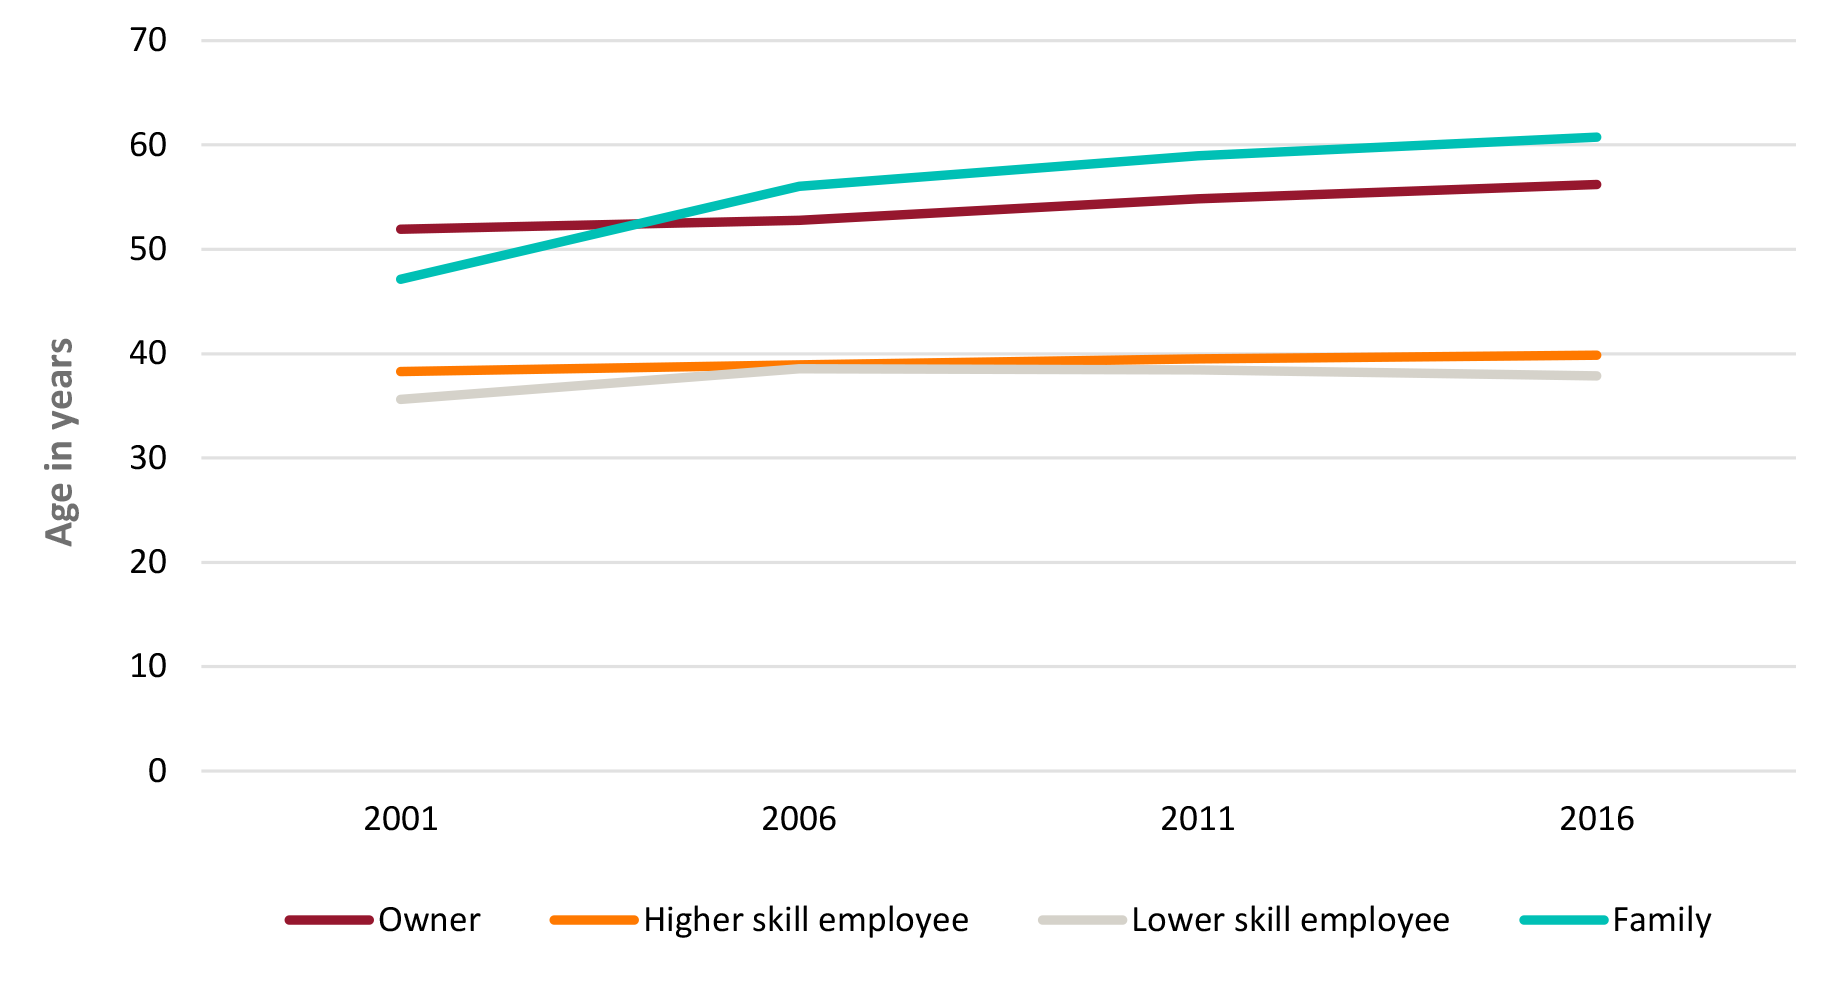 Agriculture is the oldest group of owner-operators of any of industry sector in Australia. The closet sectors to agriculture—finance and mining have a median age of 45-50 years of age, which is over a decade younger than agriculture owner-operators. The age structure of agricultural employment (excluding owner-operators) is little different from that of the Australian workforce. There are marked differences in the age structure of the owner-operator class between agricultural sub-industries. Grazing industries have an older population, this is particularly so for the beef industry where the median age exceeded 60 at the last two censuses. The vegetable and dairy industries have the youngest age profiles, being on average ten years younger than beef producers. GenderAcross the Australian economy, females account for 48% of the workforce. In agriculture only 31% of those working in the sector are female. The female share of agriculture owner-operators is not much different from the share across all sectors of the economy at a little under 30%. Agriculture is far less gendered than some other industries such as construction (less than 10 % female owner-operators) and mining at 16% female participation. For both higher and lower skill employees, the agricultural sector has a much lower female composition than is seen in the workforce as a whole. This is most obvious for higher skilled employees, 21% of whom are female in agriculture compared to over 40% of the higher skilled employee workforce as a whole. The data indicates that the agricultural workforce is slowly masculinizing. This is observed in the gradual shift from owner-manager employment to high-skill employment. There appears to be strong gender preferences at work in high-skill agricultural employment, with only 21% being female. The trend in female employment closely mirrors the overall trend of male and total employment in agriculture across 2001, 2006, 2011 and 2016. Female owner-operators have declined slightly, falling just below 30% by 2016. The proportion of lower skill female employees in agriculture has witnessed a modest rise, while the female composition of unpaid family labour has decreased significantly from 57% in 2001 to 39% by 2016. Gender composition varies greatly between agricultural sub-industries. Female owner-operators, higher skill and lower skill employees are more prevalent in other livestock raising (horses, alpacas, and bees), intensive animals (pigs and poultry), dairy, nursery and vegetables. Services to agriculture has the lowest female composition together with other crops and mixed farming. Female composition of agricultural workforce, 2016
The data on occupation reinforces the clear distinction between the masculinised occupations within the agriculture sector and those considered the traditional domain for females. Occupations with desk work or animal care tend to have higher female composition. Occupations associated with machinery, travel or arduous labour have low female composition. For example, female composition varies from 96% for bookkeepers to 3% for shearers in 2016. Educational attainment and field of educationIn 2016, the agricultural workforce had a lower level of post-secondary educational attainment than nearly all other sector workforces. However, educational attainment is rising within the agricultural workforce. This is most pronounced in the higher-skilled employee category. Younger workers in the agriculture sector tend to have higher educational attainments than older workers in the sector. The gradual rise in educational attainment of the agricultural workforce is part of a transformation common to the Australian workforce as a whole. The agricultural rise matched similar rises in almost all sectors of the economy. The owner-operator, higher skilled and unpaid family worker classes within agriculture, have the lowest level of formal educational attainment compared to all other sectors of the economy. Within the various agricultural sub-industries, the education level of skilled employees varies widely across employment status. Vegetable owner-operators are least likely (29%) to hold a post-secondary education. As expected, a greater proportion of higher skilled employees, compared to low skilled employees across all sub-industries have a post-secondary education. The most common level of educational attainment within Australian agriculture is year 10-12 secondary schooling. The second most common is Certificate level 3 or 4. Not surprisingly a higher proportion of higher skilled workers hold a post-secondary qualification, especially for Certificate 3-4 categories which include trade certificates. The most common fields of post-secondary school qualification for those working in agriculture are, in order of popularity, agricultural and environmental science, engineering, and management and commerce. The relative distribution of these fields has remained similar over the decade 2006 to 2016. IncomeIncome growth in the agricultural sector has been modest, leaving personal incomes below that experienced in quite a few other industries. Overall, the median personal incomes for agricultural employees sits below the 50th percentile relative to all other industries. The agricultural sector could be described as middle of the range. However, all agricultural workers reported real increases in personal income over the period 2001 to 2016. The rise was greatest for owner-operators, though this also appears to be the most volatile trend as well. The median income for owner-operators rose on an annual basis of 3.4%, 0.8% and 3.2% for the three intercensal periods since 2001. It should be noted that the average wealth for agricultural households is comparatively higher than the general population (Chancellor, et al, 2020). Income earned by owner-operators may also include capital gain, investments, off-farm income, and farmland values which have been rising faster than inflation in recent years (Rural Bank, 2020). CitizenshipDespite concerns at the weaknesses of the Census as a tool to enumerate counts of non-citizen workers, the data reveals a clear trend of increasing non-citizenship counts for employee labour categories. In the case of lower-skilled workers the share of non-citizens has increased nearly three-fold between 2001 and 2016, while for higher-skill employees, the non-citizen share has risen from 5% in 2001 to 13% in 2016. The owner-operator class remains little changed with a very high level of Australian citizenship. Across agricultural sub-industries Australian citizenship levels are lowest in the vegetable, fruit and meat processing sectors across all employees. However, in total agriculture has one of the lowest proportions of non-citizen labour compared to other sectors across the Australian economy. Download the report
| |||||||||||||||||||||||||||||||||||||||||||||||||||||||||||||||||||||||||||||||||||||||||||||||||||||||||||||||||||
| URL | 查看原文 | |||||||||||||||||||||||||||||||||||||||||||||||||||||||||||||||||||||||||||||||||||||||||||||||||||||||||||||||||||
| 来源平台 | Australian Bureau of Agricultural and Resource Economics and Sciences | |||||||||||||||||||||||||||||||||||||||||||||||||||||||||||||||||||||||||||||||||||||||||||||||||||||||||||||||||||
| 文献类型 | 科技报告 | |||||||||||||||||||||||||||||||||||||||||||||||||||||||||||||||||||||||||||||||||||||||||||||||||||||||||||||||||||
| 条目标识符 | http://119.78.100.173/C666/handle/2XK7JSWQ/306438 | |||||||||||||||||||||||||||||||||||||||||||||||||||||||||||||||||||||||||||||||||||||||||||||||||||||||||||||||||||
| 专题 | 资源环境科学 | |||||||||||||||||||||||||||||||||||||||||||||||||||||||||||||||||||||||||||||||||||||||||||||||||||||||||||||||||||
| 推荐引用方式 GB/T 7714 | admin. Trends in the Australian Agricultural Workforce analyses 20 years of census data,2020. |
| 条目包含的文件 | 条目无相关文件。 | |||||
| 个性服务 |
| 推荐该条目 |
| 保存到收藏夹 |
| 查看访问统计 |
| 导出为Endnote文件 |
| 谷歌学术 |
| 谷歌学术中相似的文章 |
| [admin]的文章 |
| 百度学术 |
| 百度学术中相似的文章 |
| [admin]的文章 |
| 必应学术 |
| 必应学术中相似的文章 |
| [admin]的文章 |
| 相关权益政策 |
| 暂无数据 |
| 收藏/分享 |
除非特别说明,本系统中所有内容都受版权保护,并保留所有权利。


修改评论