


Global S&T Development Trend Analysis Platform of Resources and Environment
| COVID-19 in Austria mapped: New tool projects trajectory of virus in Austria | |
| admin | |
| 2020-12-10 | |
| 发布年 | 2020 |
| 语种 | 英语 |
| 国家 | 英国 |
| 领域 | 资源环境 |
| 正文(英文) |

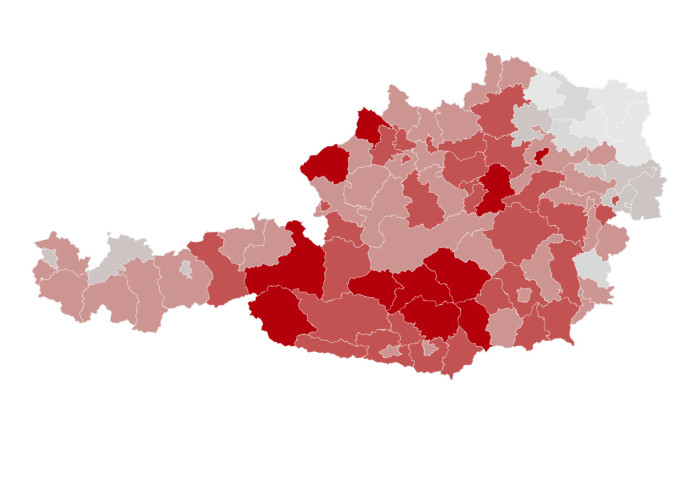
A new COVID-19 analysis tool that estimates which districts in Austria could become coronavirus hotspots has been launched by Imperial. The website tool, uses reported cases and deaths to estimate the probability any of the 94 political districts of Austria will become COVID-19 ‘hotspots’ in the next three weeks. The team behind the website, the Imperial College COVID19 Response Team, define a hotspot as a political district with more than 200 cases of COVID-19 per 100,000 of the population per week. Daily projections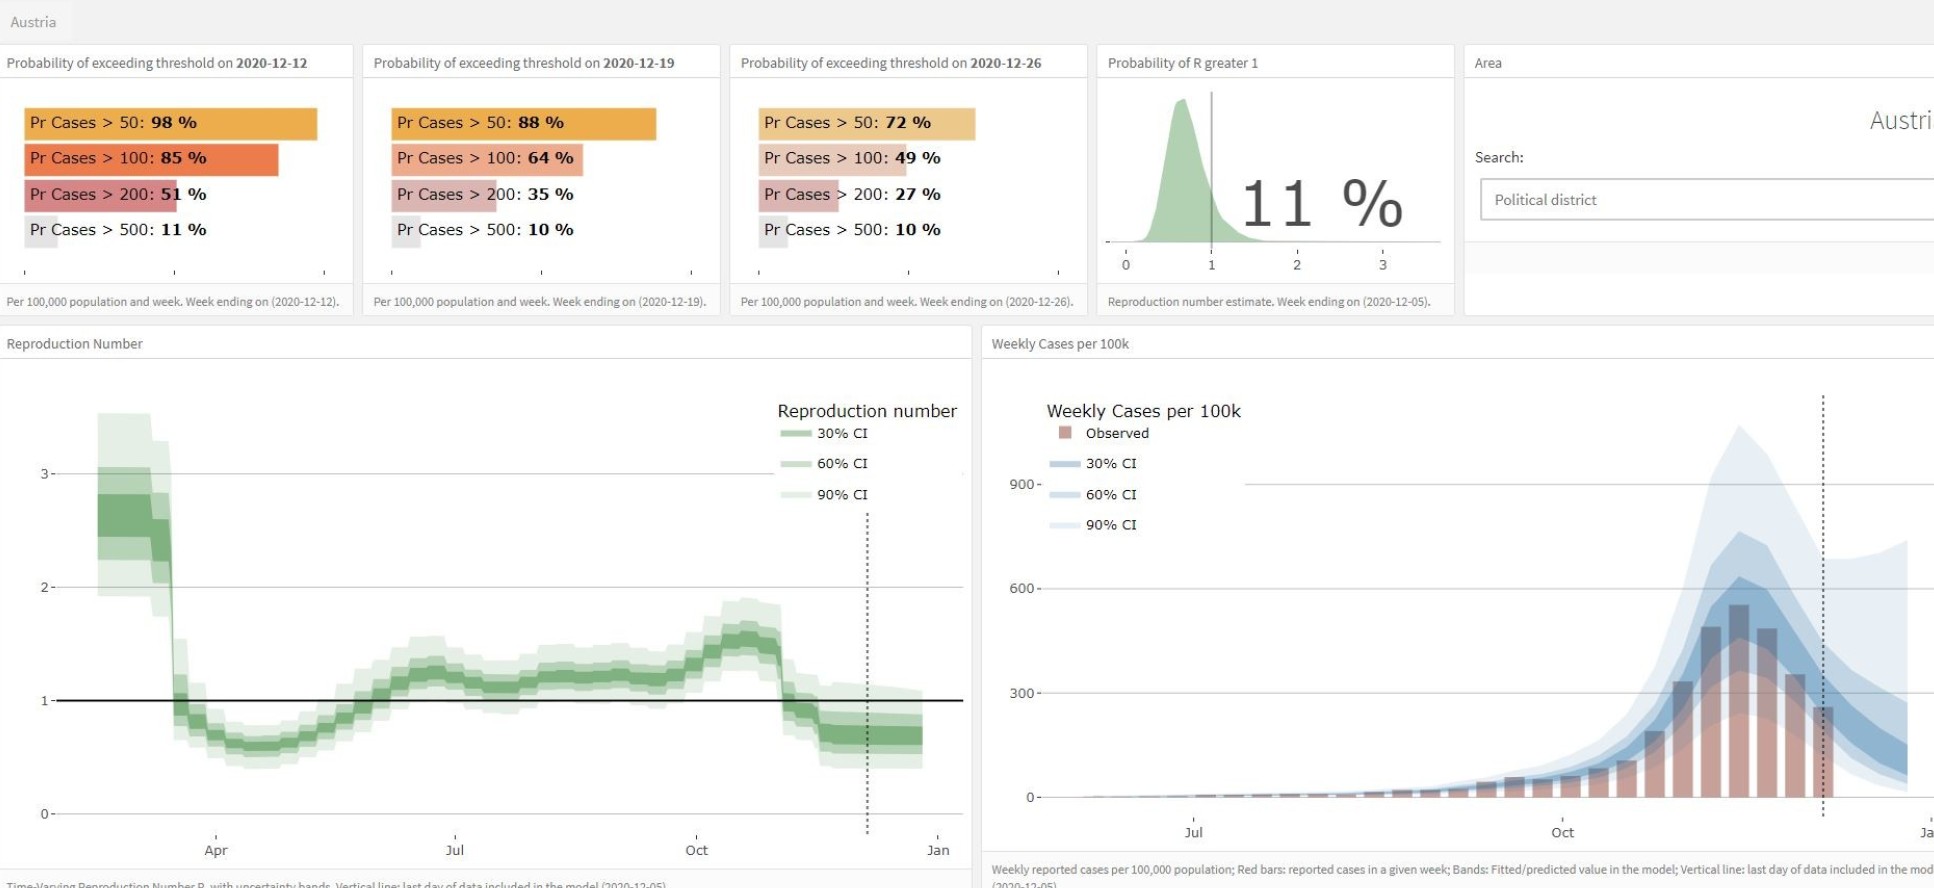
The site - which will be updated daily - currently highlights hotspots such as Tamsweg, Lienz and Murau with more than 600 reported cases per 100,000 population in the past week (up to 6 December 2020). Using data on daily reported cases and weekly reported deaths, the team model the probability (%) that a political district will become a hotspot in the following week, the week after and three weeks from now, assuming no changes to policies or behaviours. The R numberThe site also provides estimates for each of the 94 Austrian political districts on whether number of infections are likely to be increasing or decreasing in the following week, and the probability of R(t) being greater than 1 in the following week. The reproduction number R(t) indicates the number of people each infected person will pass the virus onto. An R(t) larger than 1 indicates the outbreak is not under control and cases will continue to increase. Following a second nationwide lockdown which was in place from 3 November 2020, all political districts currently show a low (less than 50%) probability of having an R(t) over 1. The website is produced by the WHO Collaborating Centre for Infectious Disease Modelling within the MRC Centre for Global Infectious Disease Analysis (GIDA), and Abdul Latif Jameel Institute for Disease and Emergency Analytics (J-IDEA) , in collaboration with the Department of Mathematics at Imperial College London and vektorraum. Dr Samir Bhatt, from the School of Public Health, said: "Here we provide high quality modelling estimates to inform decision making. Our estimates try to synthesise data and present a picture of the current rates of transmission and risk." Professor Axel Gandy, from the Department of Mathematics, said: "This is based on previous work for the UK which feeds into tier decisions by the Scottish government. We hope this proves similarly useful." Fabian Valka of vektorraum said: "We provide estimates of the reproduction number along with hotspot projections for all 94 districts of Austria. Such regionally detailed modeling was previously not available to the public. We provide a fine level of detail for local decision-making for policy-makers, public health, and the general public alike." |
| URL | 查看原文 |
| 来源平台 | Imperial College London |
| 文献类型 | 新闻 |
| 条目标识符 | http://119.78.100.173/C666/handle/2XK7JSWQ/308094 |
| 专题 | 资源环境科学 |
| 推荐引用方式 GB/T 7714 | admin. COVID-19 in Austria mapped: New tool projects trajectory of virus in Austria. 2020. |
| 条目包含的文件 | 条目无相关文件。 | |||||
| 个性服务 |
| 推荐该条目 |
| 保存到收藏夹 |
| 查看访问统计 |
| 导出为Endnote文件 |
| 谷歌学术 |
| 谷歌学术中相似的文章 |
| [admin]的文章 |
| 百度学术 |
| 百度学术中相似的文章 |
| [admin]的文章 |
| 必应学术 |
| 必应学术中相似的文章 |
| [admin]的文章 |
| 相关权益政策 |
| 暂无数据 |
| 收藏/分享 |
除非特别说明,本系统中所有内容都受版权保护,并保留所有权利。
修改评论